Research Studies Series No. 2
Stress and Job Satisfaction Among Symphony Musicians
John Breda and Patrick Kulesa
Research Studies Series No. 2
Symphony Orchestra Institute
Evanston, IL USA
Stress and Job Satisfaction among Symphony Musicians
John Breda and Patrick Kulesa
Research Study Series
No. 2
The Symphony Orchestra Institute
The mission of the Symphony Orchestra Institute is to improve the effectiveness of symphony orchestra organizations, to enhance the value they provide to their communities, and to help assure the preservation of such organizations as unique and valuable cultural institutions.
Publications in the Research Study Series present insights based on scholarly research and analysis typically focusing on particular dimensions of symphony orchestra organizations. These research-based publications are written especially for communication with symphony organizations practitioners: staff and orchestra employees, volunteers, and others closely involved in the operation and funding of orchestral organizations.
Stress and Job Satisfaction among Symphony Musicians
1. Preface
In spring 1996, the Symphony Orchestra Institute awarded a doctoral research grant to John Breda, who was in his final year of training to become a medical doctor. Prior to entering medical education, John had been a professional symphonic clarinetist. He holds two bachelor’s and a master’s degree from the New England Conservatory. From 1978 to 1982, he performed as a freelance symphonic musician, and from 1982 to 1989, played with the Oregon Symphony.
In his doctoral research-funding request, John proposed to collect and compare data relating to the psychological distress of orchestral musicians, which included related questions about job satisfaction and other aspects of orchestral work and life. John developed an extensive questionnaire, circulated it to more than 2,500 musicians, and by the end of 1996 had received responses from about 700 musicians. During 1997 and into 1998, the extensive scale of the questionnaire and responses, and the intense pressures of medical internship, forced a long deferral in the tasks of processing the responses and analyzing and interpreting the data.
In fall 1998, with the consent of John Breda, the Institute engaged Patrick Kulesa to collaborate and assist in completing the analysis and interpretation of the data. Patrick Kulesa has recently received his Ph.D. in psychology from Northwestern University, completing a doctoral dissertation exploring the impact of attitudes on memory. His research interests are in attitudes and their impact on individual behavior and organizational effectiveness.
Working together this past year, Breda and Kulesa, as researcher and author, have completed the analysis and interpretation presented in the report which follows and which the Institute is now pleased to publish and distribute. We hope this study will further advance our understanding of various factors influencing the careers and lives of symphony orchestra musicians.
December 1999 Paul R. Judy, Founder & Chairman
Stress and Job Satisfaction among Symphony Musicians
John Breda
Patrick Kulesa
Purposes
The purposes of this research were to examine the levels of stress and job satisfaction reported by symphony musicians and to determine what musician and orchestral characteristics are associated with higher levels of stress and job satisfaction. A survey was developed assessing satisfaction, stress, and musicians’ evaluations of their orchestras, music directors, and chosen profession.
In addition, the survey included several items from an earlier study by Allmendinger, Hackman, and Lehman (1994) that examined satisfaction levels in a variety of organizations, including symphony orchestras. Use of these items permitted comparisons between this report and Allmendinger et al.’s 1994 results.
Moreover, this survey included a standardized measure of perceived stress developed by Lambert and Burlingame (1996). Using norms established by these researchers, the level of stress reported by symphony musicians could be compared with psychiatric patient and non-patient samples.
Research Methods
Respondents and Procedure
Surveys were mailed to a sample of 2,563 musicians chosen from the 1995-1996 directory of the International Conference of Symphony and Opera Musicians (ICSOM). The ICSOM directory included 37 orchestras which were part of symphony organizations and 7 which were part of opera or ballet organizations. In an effort to ensure more equal representation across orchestral sections, surveys were mailed to all (1,398) non-string players in the directory, and to one of every two string players (1,165), selected alternately as their names appeared in the directory. Surveys were sent to a small number of professional musicians who were members of 2 non-ICSOM orchestras and responses from these players constituted less than 3 percent of the total replies, which numbered 698, yielding a response rate of about 28 percent.
In a letter accompanying the survey, participants were informed that the purpose of the survey was to understand the nature and causes of stress experienced by symphony musicians. Respondents were provided postage-paid envelopes in which to return the surveys.
Overview of Survey
The survey consisted of eight sections. The first was a set of nine items measuring job satisfaction. Respondents rated the extent of their satisfaction with various aspects of their jobs (e.g., pay and fringe benefits, feelings of accomplishment, support and respect received from management), using 7-point scales (1 = extremely dissatisfied, 7 = extremely satisfied).
Section 2 contained 18 items concerning satisfaction with various aspects of orchestras and conductors, including clarity of musical standards, orchestral morale, musician voice in decision making, and the role of orchestral management in settling controversies. Respondents rated the extent to which each item was an accurate description of their orchestras, using 7-point scales (1 = very inaccurate, 7 = very accurate).
The third section was the 45-item Outcome Questionnaire (OQ) developed by Lambert and Burlingame (1996). The OQ originally developed as a diagnostic tool for patients undergoing psychotherapy, is used to assess the extent of symptoms associated with stress-related illnesses. In the context of this survey, the OQ served as a measure of the subjective level of stress experienced by symphony musicians. As described by Lambert, Hansen, Umpress, Lunnen, Okiishi, Burlingame, Huefner, and Reisinger (1996), the items of the OQ concern how the respondent feels inside (e.g., “I feel weak” and “I feel fearful”), how well the respondent gets along with others (e.g., “I have frequent arguments” and “I am satisfied with my relationships with others”), and how well the respondent is performing at work or school (e.g., “I find my work/school satisfying” and “I feel stressed at work/school”). Respondents rated each item for frequency of occurrence over the past week, using 5-point scales (1 = never, 5 = almost always). Standard procedures described by Lambert et al. (1996) were used to compute scores on the OQ for each respondent. Scores could range from 0 to 180, with higher values indicating greater perceived stress.
The fourth section of the survey consisted of 24 items assessing respondents’ satisfaction with being musicians in their orchestras. These items were more specific in content than the items in the first section. In particular, items in Section 4 addressed the impact of the orchestra on family life, trust in the music director, the effect of being a musician on general health, and the tendency to report or work through physical pain due to performing. Respondents rated their extent of agreement with each item, using 7-point scales (1 = disagree strongly, 7 = agree strongly).
Section 5 of the survey contained 13 items evaluating the music director, including clarity of expectations, quality of teaching, and acceptance of suggestions from musicians. Respondents rated each item for frequency of occurrence, using 5-point scales (1 = never, 5 = always).
Section 6 consisted of 13 items assessing feelings about symphony orchestra performing as a profession, including adequacy of union representation, career choice satisfaction, and control over career path. Respondents rated their extent of agreement with each item, using 7-point scales (1 = disagree strongly, 7 = agree strongly).
The seventh section of the survey addressed the prevalence of performance anxiety and the use of beta-blocking drugs to control that anxiety. Respondents indicated the frequency with which they had experienced levels of performance anxiety severe enough to affect their ability to perform to their capabilities (1- 9 times per month, 10-20 times per month, or more than 20 times per month).
Respondents also indicated whether they had used beta-blocking drugs, if they did so under the guidance of a physician, and if they had sought help from a physician to discontinue use of beta-blocking drugs. Finally, respondents indicated whether they had successfully used any of the following techniques to control performance anxiety: physical exercise routine, meditation, deep breathing, deep muscle relaxation, focusing techniques, desensitization, and cognitive restructuring.
The last section of the survey asked for the following information from each respondent: gender, marital status, age (divided into six levels: under 20, 20-29, 30-39, 40-49, 50-65, or over 65), length of service in current orchestra (collapsed into three levels: fewer than 9 years, 9-25 years, or more than 25 years), tenure (yes or no), position in the orchestra (principal/assistant principal or other), instrument group (string player or other), number of different orchestral positions held as a full-time employee, use of additional job to supplement income (yes or no), length of orchestral season (fewer than 29 weeks, 30-39 weeks, or 40-52 weeks), and counseling sought for work-related problems (yes or no). Finally, each respondent read a list of orchestras divided into five groups based on published wage scales for ICSOM orchestras as of the 1994-1995 season. They indicated into which of these five groups their current orchestra was placed. Level of annual wage is indicated in this report as first ($60,000 or more), second ($50,000-60,000), third ($40,000-50,000), fourth ($30,000- 40,000), or fifth level (under $30,000).
Research Findings
Describing the Sample
Among the musicians who completed and returned the survey, 63 percent are male and 68 percent are married. Their average age is between 30 and 39 years and their average length of service in their current orchestras is about eight years. Fewer than one-half (42 percent) indicated they are principal or assistant principal players and about that number (39 percent) are string players. Most are tenured (92 percent). On average, the musicians have held two different full-time orchestral positions, and the majority of them (60 percent) currently work in another position to supplement their orchestral salaries. Most (63 percent) are in orchestras with a season length of 40 to 52 weeks. Fifty-two percent of the musicians have taken beta-blocking drugs to control performance anxiety. Most (62 percent) have used drugs while under the care of a physician, and a small minority (15 percent) report seeking the guidance of a physician to discontinue use of beta-blocking drugs. One-third report seeking counseling for problems associated with their work.
These demographic characteristics indicate that the musicians in the sample are somewhat younger and less experienced than average. Data obtained from 15 ICSOM orchestras for the years 1987, 1992, and 1997 showed that the average age of ICSOM players was about 45 (compared with a range of 30 to 39 in this survey), and the average length of experience was just over 16 years (compared with about 8 years in this survey). These differences between average musicians and the sample used in this survey should be considered when interpreting the findings in this report.
Creating Scales from Survey Items
Because many sections of the survey contain a large number of items, several measures were created by averaging responses to various groups of items. In this way, the large pool of survey items was reduced to a smaller set of measures to simplify subsequent analyses. Two approaches were taken to determine which items should be grouped together and averaged. When a set of items was designed to measure opinions about the same aspect of orchestral performing, a statistic called coefficient alpha was calculated for that group of items.
Coefficient alpha is a single number that expresses how well a set of items form a group. Alphas can range from 0 to 1, with higher values indicating the items form a group to a greater extent. Although there is no definitive rule concerning the appropriate level of alpha, values 0.60 or higher are often considered acceptable. To illustrate the use of this statistic, all of the items in Section 1 measure job satisfaction. Consequently, a coefficient alpha could be calculated for these nine items to determine how well they form one group. Because all of the items in Section 1 measured job satisfaction, all of the items in Section 3 measured perceived stress, all of the items in Section 5 measured music director evaluation, and all of the items in Section 6 measured evaluation of the profession, separate coefficient alphas were calculated for each of these sections.
The second method used to determine which items could be grouped together was a statistical technique called factor analysis. Factor analysis identifies groups of items from a larger pool that are strongly related to each other and can be combined into several sets of items, each concerning the same underlying idea. For example, if respondents who strongly agree with the statement “I frequently think of quitting this job” tend to strongly agree with the statement “I look forward to moving on to a new position,” scores on these two items would be strongly related to each other, and these two items would likely be identified by a factor analysis as members of the same group. Job
dissatisfaction could be the underlying idea expressed by these two items and
other items with which they are highly related. Factor analysis is well suited to
a context in which respondents have answered a diverse set of items, and
researchers seek to specify several groups of items within the larger set. Because
Sections 2 and 4 of the survey fit this description, separate factor analyses were
performed on the 18 items in Section 2 and the 24 items in Section 4.
Coefficient Alphas of Sections 1, 5, and 6
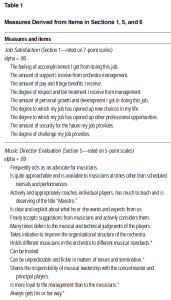
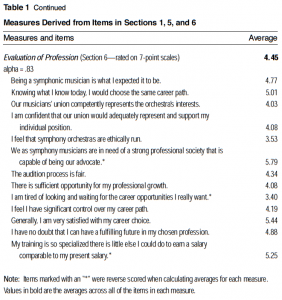
Separate coefficient alphas were calculated for the nine items in Section 1, the 13 items in Section 5, and the 13 items in Section 6. Results are shown in Table 1, along with the items from each section. As shown by the adequate value of the coefficient alpha (.86), the nine items in Section 1 assessing job satisfaction adequately form a group, and scores on these items were averaged into a measure. Similarly, based on adequate coefficient alpha values, scores on the
13 items in Section 5 were averaged into a measure (alpha = .89), subsequently called music director evaluation, and scores on the 13 items in Section 6 were averaged into a measure (alpha = .83), subsequently called evaluation of profession.
As indicated in Table 1, some items were reverse-scored before they were averaged together with other items. Reverse-scoring assures that all the items in a measure are scored in the same direction. Prior to averaging, all items were scored such that a higher number reflected a more favorable opinion. For instance, because high scores on the item asking whether the music director “is more loyal to the management than to the musicians” reflect an unfavorable evaluation of the music director, scores on this item were reversed before determining an average across all of the items of the musician director measure.
Consequently, the overall averages for each measure (shown in bold in Table 1) indicate the extent to which opinions are favorable. The values shown in the table for each item are the actual averages for each item before any necessary reverse-scoring.
Coefficient Alpha of Section 3
A coefficient alpha was also calculated for the 45-item OQ measure from Section 3 of the survey. Because this value of alpha was acceptable (.94), these 45 items were averaged into a measure, referred to subsequently as perceived stress.
Factor Analysis of Items from Section 2
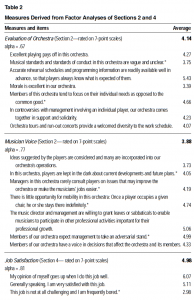
Results of the factor analysis of the 18 items in Section 2 identified two groups of items. As shown in Table 2, one group included seven items concerning evaluations of orchestras. Because these items also displayed an adequate coefficient alpha (.67), scores on these items were averaged into a measure, referred to subsequently as evaluation of orchestra. The content of these items reflects perceptions of orchestral morale, group solidarity, and the clear communication of musical standards and rehearsal and programming schedules.
The second group of items identified by the factor analysis of Section 2 included seven items concerning perceptions of musician voice in the affairs of the orchestra (see Table 2). Because these seven items also displayed an adequate coefficient alpha (.77), scores on these items were averaged into a measure, referred to subsequently as musician voice. The content of these items reflects the use of ideas generated by musicians, consultation with players on important issues, and freedom for musicians to pursue professional growth opportunities.
As indicated in Table 2, several items from the evaluation of orchestra and musician voice scales were reverse-scored.
In the course of creating two groups of items from Section 2, scores on four items (not shown in Table 2) were excluded. Such loss of individual items based on the results of factor analysis is very common and reflects the fact that not all items fit adequately into a group with other items. The disadvantage incurred from the loss of individual items is minimal compared with the advantage gained by grouping items together for use in other statistical analyses.
Factor Analysis of Items from Section 4
Results of the factor analysis of the 24 items in Section 4 identified four groups of items. As shown in Table 2, one group included seven items concerning job satisfaction. These items displayed an adequate coefficient alpha (.81). Because the content of these seven items overlaps to a large extent with the nine job satisfaction items in Section 1, all 16 of these items were averaged together to form a single job satisfaction measure that also displayed an adequate coefficient alpha (.90). This 16-item job satisfaction measure is used in subsequent analyses in this report.
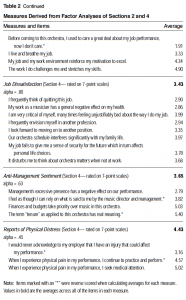
The second group of items identified by the factor analysis of Section 4 included eight items that concern dissatisfaction with the job of symphony musician. Because these items also displayed an adequate coefficient alpha (.80), scores on these items were averaged into a measure, referred to subsequently as job dissatisfaction. The content of these items reflects the desire to leave the job of symphony musician, concerns about the effects of the job on health and family life, and feelings of insecurity about the future stemming from the job.
The third group of items identified by the factor analysis of Section 4 included four items concerning views of symphony management. Because these items also displayed an adequate coefficient alpha (.63), scores on these items were averaged into a measure, subsequently referred to as anti-management sentiment. The content of these items reflects a general negative view of management, a mistrust of management, and the perception that management is more concerned with budgets than musical performance.
Finally, the fourth group of items identified by the factor analysis of Section 4 included three items concerning willingness to report physical discomfort from performance. Although these items displayed a slightly less than adequate coefficient alpha (.45), scores on these items were averaged into a measure, subsequently referred to as reports of physical distress. Because alpha levels become smaller as the number of scale items in a measure decreases, this relatively low value was not unexpected. The reports of physical distress measure was retained due to the research interest in stress and its effects on performance, which would be expected to include the need to seek attention for physical discomfort.
Based on the results of the factor analysis of Section 4, scores on two items (not shown in Table 2) were excluded. Also, consistent with the results of Section 2, a number of items were reverse-scored before averaging (see Table 2).
Extent of Agreement
It is informative at this point to step back and look at the general extent of agreement with each of the measures formed from the prior analyses. Examining the average score across the items of each measure is especially useful in this context. In addition, it is also possible to look at agreement with each item individually. For items rated on 7-point scales, which include all of the items except those measuring music director evaluation, an average above the scale midpoint of 4.00 suggests some level of agreement with that measure or item, and an average below 4.00 suggests some level of disagreement. Similarly, for items rated on 5-point scales (i.e., those measuring music director evaluation), an average above the scale midpoint of 3.00 suggests some level of agreement, and an average below 3.00 suggests some level of disagreement.
Recall that the items in Section 1 measuring job satisfaction were rated on 7-point scales, with higher numbers indicating more satisfaction. As shown in bold under the column labeled “average” in Table 1, the average level of satisfaction among the musicians surveyed is 4.54, suggesting a slight amount of overall satisfaction. Among the individual job satisfaction items, respondents were generally dissatisfied with the amount of support they receive from management (average = 3.92), but quite satisfied with the feeling of accomplishment and challenge associated with the job (average = 5.52). Items measuring music director evaluation were rated on 5-point scales. As shown in Table 1, respondents reported a slightly unfavorable overall evaluation of the music director (average = 2.84). General dissatisfaction was expressed with how frequently the music director coaches individual players (average = 2.47), defers to the judgments of players (average = 2.64), and takes initiative to improve the organizational structure of the orchestra (average = 2.49), but overall satisfaction was expressed with music directors’ clear expectations (average = 3.37) and willingness to share responsibility for musical leadership (average = 3.10). Also shown in Table 1 is a slightly overall positive evaluation of the profession of symphony musician, evidenced by the average of 4.45 on a 7-point scale. In general, respondents reported they were satisfied with their career choice (average = 5.44), perceived their career as fulfilling (average = 4.88), and would choose the same career path again (average = 5.01). Nonetheless, there was a slight level of disagreement expressed with the statement that orchestras are run ethically (average = 3.53).
As shown in Table 2, respondents reported a very slight favorable evaluation of their orchestras (4.14 on a 7-point scale). They were especially happy with the communication of scheduling information (average = 5.43), rewards for excellent playing (average = 4.27), and the solidarity of the players in disputes (average = 4.23), but respondents viewed orchestral morale as less than excellent (average = 3.39). In contrast, musicians reported slight dissatisfaction overall with their voice in the orchestra (3.88 on a 7-point scale). Respondents reported they expect an adversarial stance from management (average = 4.99), and they were slightly critical of the amount of consideration given to their ideas (average = 3.73). They also indicated a lack of opportunities for mobility (average = 4.74) and a somewhat inadequate level of consultation with managers (average = 4.19). Moreover, similar to Section 1, job satisfaction as measured by the seven items in Section 4 was quite favorable (4.98 on a 7- point scale). Musicians reported they feel good about themselves when they perform well (average = 6.07), were generally satisfied with their jobs (average = 5.11), and disagreed that their jobs lack challenge (average = 2.98). The average for the combined job satisfaction measure containing the nine items from Section 1 and the seven items from Section 4 was also slightly favorable (4.76 on a 7-point scale).
Consistent with these findings, overall job dissatisfaction was low (3.43 on a 7-point scale). Average agreement with the items in this measure, which would indicate dissatisfaction, never exceeded the midpoint of 4.00 (see Table 2). Also shown in Table 2 is the overall average for anti-management sentiment
(3.65 on a 7-point scale), which suggests slight overall satisfaction with orchestral management. Players generally disagreed that management is intrusive and negatively affects their performance (average = 2.79); however, they agreed overall that finances and budgets take priority over music (average = 5.03). Finally, musicians indicated a general willingness to report physical distress from performing (4.43 on a 7-point scale). They reported seeking medical attention for pain (average = 5.02), but they also admitted a general tendency to continue performing despite the discomfort (average = 4.57).
Although opinions are not strongly favorable, this analysis of level of agreement paints a somewhat positive picture of musicians’ opinions.
Respondents reported moderate levels of job satisfaction and a low level of job dissatisfaction. Generally, they viewed their orchestras favorably, were not overly critical of management, felt free to report physical discomfort, and evaluated their chosen profession positively. Nonetheless, they were generally dissatisfied with the behavior of their music directors and their voice in orchestral matters.
Comparing Stress Levels on the OQ to Lambert et al. (1996)
In their discussion of the OQ, Lambert et al. (1996) reported the average OQ scores of a sample of individuals not seeking psychiatric counseling, a group to which musicians’ OQ scores could be compared reasonably. Specifically, they indicated that the average OQ score for a non-patient sample was 45.19. That average for the musicians in this sample is 46.82, suggesting little or no difference between the two samples. In contrast, the average OQ total score of a psychiatric patient sample in the Lambert study was 83.09. It is thus clear that the stress levels reported by musicians in this sample are well within the range expected for well-functioning individuals.
Comparing Response Levels to Allmendinger et al. (1994)
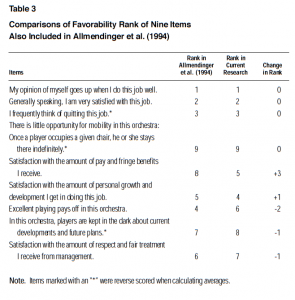
Nine items in this survey were also included in a study of symphony musicians’ opinions conducted by Allmendinger et al. (1994). Each item was rated on a 7- point scale in both the prior research and this survey, permitting comparisons between the opinions expressed. Because the musicians in the Allmendinger sample were on average older and from a wider range of orchestras than our sample, we made comparisons between the two studies by ranking the opinions expressed on the nine common items from most to least favorable. Items were scored such that higher values reflected more favorable opinions. As shown in Table 3, the top three favorable items from Allmendinger et al.’s results and our\ research were identical and concerned job satisfaction generally. Two items were higher in rank in our research than in the prior study. Specifically, satisfaction with pay and benefits and with opportunities for personal growth and development ranked higher among the nine items in our research than in the earlier study. These findings suggest that satisfaction with these factors…
…may have increased somewhat since the earlier work. In contrast, satisfaction with involvement and degree of respect and fair treatment, as well as the perception that excellent playing pays off, ranked lower in our research than in Allmendinger et al., suggesting that satisfaction with these factors may have decreased over time. Also, satisfaction with opportunities for mobility remained lowest among the nine items in both surveys. Note that the items showing an increase in favorability concern personal work experiences, whereas the items showing a decrease concern treatment of musicians by symphony organizations.
Although it is difficult to make firm conclusions based on a small number of items, these results may signal increasing satisfaction with the job of symphony musician accompanied by increasing dissatisfaction with the functioning of symphony organizations.
Although these results suggest that general job satisfaction levels remain high and may be increasing in some areas, they should be considered in light ofAllmendinger et al.’s finding that symphony musicians report moderately low levels of satisfaction relative to other professions. Specifically, the Allmendinger study found that musicians’ reported satisfaction level was only about eighth highest among thirteen professions surveyed. Our results, showing relative stability in levels of general job satisfaction, suggest that musicians have probably not gained much ground on other professions in recent years.
Coping with Performance Anxiety
Just more than one-half (54 percent) of those surveyed reported experiencing anxiety severe enough to affect their performances one to nine times per month.
Nine percent reported severe anxiety 10 to 20 times per month, and three percent report severe anxiety more than 20 times per month.
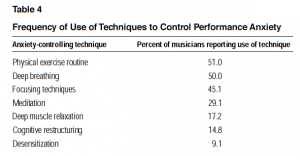
As shown in Table 4, physical exercise, deep breathing, and focusing techniques are the most common methods used to control performance anxiety. Less common are meditation, deep muscle relaxation, cognitive restructuring, and desensitization.
Exploring Differences in Levels of Stress and Satisfaction
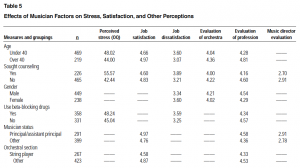
In this part of the report, we explore differences between the perceptions of various groups of musicians. For example, are older musicians more satisfied than younger musicians? In the analyses that follow, appropriate statistical tests were performed to determine whether differences in opinions between various groups of respondents (e.g., the job satisfaction expressed by men versus women) are meaningful in a statistical sense, and only such meaningful differences are discussed. Our results are summarized in Table 5, which presents average opinions within selected groups of musicians. Only meaningful statistical differences are included in the table. Blank entries in Table 5 indicate cases for which the differences in opinions between groups of musicians were not…
…statistically meaningful. For example, the findings presented in Table 5 for age groups compare musicians under 40 to those over 40. Reading across the table, the results show that younger and older musicians differ in terms of their perceived stress, job satisfaction, job dissatisfaction, evaluation of the orchestra, and evaluation of the profession, but as indicated by the blank entries under the far right column, younger and older musicians do not differ in their evaluations of the music director.
Musician characteristics. Characteristics related to the musicians in the sample include gender, age, length of service in current orchestra, use of medication to control performance anxiety, and seeking counseling for problems related to work. Examining the results by age level showed that musicians above age 40 differ from those below age 40 on a number of the measures in this survey. As shown in Table 5, relative to musicians over age 40, younger musicians experienced more perceived stress (as shown by higher scores on the OQ), indicated lower job satisfaction, report more job dissatisfaction, and evaluate their orchestras and the profession less favorably. Also found, but not shown in the table, were the following: younger musicians had a more negative view of management (average = 3.75) than older musicians (average = 3.45) and perceived less musician voice (average = 3.80) than their older colleagues (average = 4.04).
Many of these same factors distinguish those who have sought counseling for work-related problems from those who have not (see Table 5). Specifically, relative to those not seeking counseling, those in counseling reported more stress, less job satisfaction, more job dissatisfaction, and a more negative view of the orchestra, the profession, and the music director. Also (but not shown in Table 5), those who had sought counseling reported a more negative view of management (average = 3.80) than other musicians (average = 3.58).
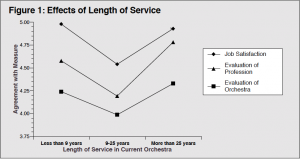
The relationship between musician opinion and length of service in current orchestra is more complex. In particular, those with a moderate length of service (9 to 25 years) tended to report more negative opinions than those with very little experience (fewer than 9 years) or quite a bit of experience (more than 25 years) in their current orchestras. As shown in Figure 1, this pattern is true for job satisfaction and evaluations of the orchestra and the profession.
Several meaningful gender differences were found. As shown in Table 5, women indicated more job dissatisfaction than men, and they also evaluated their orchestras and the profession less favorably than men. In addition (but not shown in Table 5), women showed a greater tendency to report physical distress (average = 4.60) than men (average = 4.33).
Finally, those who said they used medication to control performance anxiety reported higher levels of stress, more job dissatisfaction, and a more negative evaluation of the profession than those who did not use medication (see Table 5).
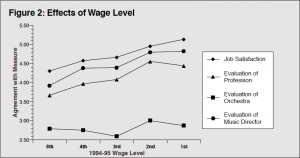
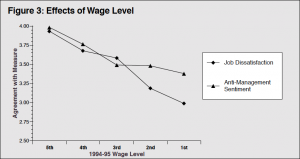
Orchestral characteristics. Characteristics related to the respondents’ orchestras were musician status, orchestral section, orchestral season length, and 1994-1995 wage level. Wage level emerged as the most important of these factors. As shown in Figure 2, musicians from higher paying orchestras (as indicated by wage levels closer to the first level) tended to report more job satisfaction, and they also indicated more positive evaluations of the orchestra, music director, and profession. In addition, as shown in Figure 3, musicians from higher paying orchestras tended to report less job dissatisfaction and anti-management sentiment. It is also generally true that higher paid musicians reported less perceived stress on the OQ measure. Respondents from the highest paid orchestras report less stress (average = 44.34) than those at the second (average…
…= 44.60), fourth (average = 46.62), and fifth (average = 48.86) levels, although those at the third level reported the most stress (average = 53.44).
As shown in Table 5, musicians at the principal or assistant principal level reported more job satisfaction and evaluated the music director and the profession more favorably than other players. Also, string players reported less job satisfaction and evaluated the profession less favorably than other players.
String players were also more likely to report physical distress (average = 4.55) than other players (average = 4.36).
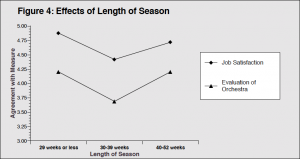
Season length also produced a few meaningful differences. Specifically, as shown in Figure 4, musicians from orchestras with a medium length of season (30 to 39 weeks) reported less job satisfaction and a more unfavorable evaluation of the orchestra than musicians from orchestras with a short length of season (29 weeks or less) or a long length of season (40 to 52 weeks). We also found that musicians from orchestras with a long length of season evaluated the profession more highly (average = 4.59) than all other musicians (average = 4.21), and reported less job dissatisfaction (average = 3.29) than all other musicians (average = 3.65).
Other Factors Associated with Stress and Satisfaction
In addition to examining the differences in stress and job satisfaction between different types of musicians and orchestras, it is useful to look at which measures are most closely related to perceived stress and job satisfaction, the measures of primary focus in this research. A statistic called a correlation coefficient is appropriate in this context. A correlation coefficient describes the nature and strength of the relationship between two measures. Correlation coefficients can range from -1 to +1. A correlation with a positive value indicates that high scores on one measure are associated with high scores on the other, and that low scores are associated with low scores. A correlation with a negative value indicates that high scores on one measures are associated with low scores on the other, and that low scores are associated with high scores. For instance, the correlation between job satisfaction and evaluation of the profession may be positive, indicating that musicians who are more satisfied with their jobs also tend to like their profession more. In contrast, the correlation between perceived stress and evaluation of the profession may be negative, indicating that musicians who are more stressed tend to like their profession less.
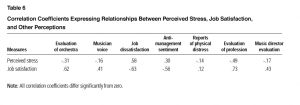
Shown in Table 6 are the correlations between perceived stress and job satisfaction and the other measures formed from the survey. All of the presented correlations are meaningfully different from zero. To illustrate how to interpret correlations, look at the bottom line of the table, which displays the correlations between job satisfaction and other measures. The value of .62 under the evaluation of orchestra column means that to the extent musicians report they are satisfied with their jobs, they also tend to evaluate the orchestra more favorably. Reading across the row labeled “Perceived stress” in Table 6, the results indicate that more perceived stress is associated with more job dissatisfaction and more anti-management sentiment, as shown by the positive values of the correlations between these measures and stress. Also, perceived stress is associated with less positive evaluations of the orchestra, music director, musician voice, and profession, as shown by the negative values of the correlations between these measures and stress. Finally, more stress is associated with less likelihood of reporting physical distress.
Turning to the correlations with job satisfaction, shown along the row labeled “Job satisfaction” in Table 6, more satisfaction is associated with less job dissatisfaction and less anti-management sentiment, and more positive evaluations of the orchestra, music director, musician voice, and profession.
Also, more job satisfaction is associated with an increased tendency to report physical distress from performing.
It is also important to examine the size of the correlation coefficients in
Table 6. For perceived stress, the correlation with the largest value is the relationship between stress and job dissatisfaction (.58), suggesting that extent of dissatisfaction is more relevant to stress than the other measures. For job satisfaction, the correlation with the largest value is the relationship between satisfaction and evaluation of the profession (.73), suggesting that evaluation of the profession is more relevant to job satisfaction than the other measures.
Another way to consider the issue of which measures are most closely related to stress and job satisfaction is to use a statistical technique called multiple regression. In short, a multiple regression analysis puts all of the measures listed along the top row of Table 6 in competition with each other to find out which ones are most relevant to stress and job satisfaction. The most relevant measures can be considered “key drivers” of musician stress and satisfaction. For perceived stress, the results of a multiple regression analysis showed that job dissatisfaction and evaluation of the profession were the most relevant factors to consider when trying to explain the sources of stress among musicians. For job satisfaction, evaluation of the orchestra, anti-management sentiment, job dissatisfaction, and evaluation of the profession all emerged as the most relevant factors.
Summary and Implications
The results of this survey indicate that symphony musicians as a group are moderately satisfied with their jobs and career choices. Overall, they reported slightly positive levels of job satisfaction and low levels of job dissatisfaction.
They generally approved of the profession, the management, and the orchestra.
In addition, the levels of stress they reported are no different from those of average, well functioning individuals. Those reporting more stress were less willing to report physical discomfort due to performing. Comparisons with Allmendinger et al.’s 1994 report suggest that satisfaction with pay and fringe benefits, and opportunities for personal growth and development, may have increased since the time of the earlier research, and satisfaction with treatment by management may have decreased. In light of Allmendinger’s prior job satisfaction findings, ranking musicians eighth out of thirteen professions studied, it may be that musicians have not improved their standing much. Although musicians’ reports are moderately positive in many areas, they clearly see room for improvement in their organizations. Specifically, they are generally dissatisfied with their voice in matters affecting the orchestra, and they are unhappy with the job performance of their music directors. Moreover, the correlations in Table 6 suggest that increasing musicians’ perceived voice in orchestral matters, and improving perceptions of management and music directors, would likely increase job satisfaction and reduce perceived stress.
The results in Table 5 indicate that musician age has a major effect on opinions. Specifically, younger musicians are more stressed, less satisfied, and more critical of their orchestras and their profession than older musicians. The fact that age level produces differences in many of the concepts measured in this survey is of interest. Recall that the sample used in this study was on average younger and less experienced than musicians as a group, indicating that our results may paint a rather vivid portrait of the critical views of younger players. It may be true that musicians naturally come to value their jobs and profession as they become older, indicating that there is little symphony organizations could do to improve the lives of their younger members. This perspective would suggest that a longer length of service in an orchestra would lead to more satisfaction; however, the results shown in Figure 2, indicating that moderate lengths of service in an orchestra (i.e., 9 to 25 years) are associated with less satisfaction and more negative evaluations of the orchestra and the profession (when compared with short or long lengths of service), are inconsistent with this view. If simply spending more time in an orchestra does not inevitably improve job satisfaction, then questioning what symphony organizations can do to assist their younger members becomes more appropriate. For instance, are there adequate professional development programs in place to help young musicians develop better skills and more confidence?
How do symphonies assist younger members in meeting the demands of balancing career and family life, issues likely to be important to many musicians under age 40?
Younger musicians are naturally more hopeful. Less experienced musicians may be quite pleased with their perceived career potential and optimistic about their futures in their newly chosen profession. However, without sufficient avenues for professional and personal growth, the positive attitudes of the newest members of an orchestra organization may be transformed into increased job stresses and dissatisfaction. Players in the middle of their careers may be beyond the positive influences of the novelty of the job, but not yet experienced enough to reap the benefits of more advanced career stages. As years of service to a given orchestra increase, a musician may see options for career choices diminishing and, therefore, may be more accepting of present circumstances.
Additionally, players who can look back on long careers in an orchestra may take great pride in their advanced career status and evaluate their jobs favorably as a consequence. Alternatively, musicians may turn toward other aspects of their lives outside the orchestra for fulfillment. In any of these cases, perceived job stress could be lessened as musicians’ terms of service increase within an orchestra. Our results suggest that these are important issues for symphony managements and players to consider.
Our results also showed that the use of beta blocking drugs to control performance anxiety is associated with more stress and less job satisfaction, along with a more negative view of the orchestra and the profession. Use of such medications was reported by more than one-half of the sample. Moreover, 60 percent of those under age 40 reported using beta-blocking drugs, compared with just 34 percent of those over 40. Thus, age again emerges as an important factor for understanding musicians’ opinions and behaviors.
Seeking counseling for work-related problems is another musician factor closely related to perceived stress and satisfaction. Musicians who seek counseling tend to be those who are more stressed, less satisfied, and more critical of their orchestra, profession, and music director. Also, about one-third of the symphony musicians surveyed experienced enough job-related stress or dissatisfaction to seek counseling. Clearly, the stress and dissatisfaction associated with being a musician are very troubling to a substantial number of respondents.
Not surprisingly, higher wages are associated with more positive opinions of the job and the profession. Musicians in orchestras offering lower compensation reported more stress, less job satisfaction, and increased job dissatisfaction. Different wage levels probably reflect a number of aspects of symphony organizations. Higher-paying orchestras are often among the most prestigious and attract and retain the most talented musicians. Consequently, the importance of wage levels suggests that being a member of a more prominent symphony orchestra boosts satisfaction levels and generally acts as a buffer against stress.
A similarly complex relationship was found between length of orchestral season and both job satisfaction and evaluation of the orchestra. In particular, a moderate length of season (i.e., 30 to 39 weeks) is associated with less satisfaction and more negative evaluations of the orchestra than short or long lengths of season. Players in orchestras with long season lengths are likely very invested in their careers and may be members of more prestigious orchestras, suggesting that the status, prestige, and income they enjoy motivate positive views of their jobs. Musicians from orchestras with short season lengths are more likely to hold other jobs to supplement their income. In fact, in this survey, 89 percent of musicians who reported season lengths of 29 weeks or less also indicated they held other positions to supplement their incomes. These additional jobs may lead musicians to perceive their orchestral work as an important, enjoyable, but not a critically necessary part of their lives, potentially motivating more positive opinions. Also, since these players rely on income sources outside their orchestras, they may feel they have more control over their careers and life situations, and are less reliant upon the orchestral management and structure for their resources. Players from orchestras with moderate lengths of season may experience more severe economic pressures. For about two-thirds of the year, their schedules are filled with rehearsals and concerts, and yet their overall income levels may be less than adequate. In addition, holding other jobs may be especially difficult given the constraints imposed by the schedule of the orchestra. These tensions may lead to less job satisfaction and more negative opinions of the orchestra.
Findings from correlations and multiple regressions point to job dissatisfaction and evaluation of the profession as most relevant to stress. These findings suggest that symphony organizations could reduce musician stress by decreasing job dissatisfaction and bolstering evaluations of the profession. A focus on job dissatisfaction might involve being more sensitive to the effects of performing on musicians’ health and ensuring orchestral schedules interfere less with family life.
In addition, findings also show that job dissatisfaction and evaluations of the orchestra, the management, and the symphony musician profession are most relevant to job satisfaction. Consequently, job satisfaction might be increased by improving perceptions of the orchestra, the management, and the profession, and also by reducing job dissatisfaction. A focus on improving evaluations of the orchestra might involve increasing solidarity among players, bolstering morale, and providing a more diverse work schedule. Improving perceptions of management might best be achieved by working to alter the perception that management is more concerned with budgeting and finances than the quality of music.
The issue of how to address musicians’ evaluation of the profession, which is relevant to both perceived stress and job satisfaction, is more challenging. It is important to note that, in addition to being consequential for job satisfaction and stress levels, evaluation of the profession also produces meaningful differences across all of the musician and orchestral factors presented in Table
5. To gain more insight into the relationships among stress, job satisfaction, and evaluation of the profession, participants were divided into four groups: (a) those highest in stress and lowest in satisfaction (the most disadvantaged group), (b) those lowest in stress and highest in satisfaction (the most advantaged group), (c) those lowest in both stress and job satisfaction, and (d) those highest in both stress and job satisfaction. Average scores for evaluation of the profession were then computed for each group. Results show that musicians from the most disadvantaged group are the least favorable toward the profession (average = 3.46), whereas musicians from the most advantaged group are the most favorable toward the profession (average = 5.31). Clearly, musicians benefit in many ways to the extent they are satisfied with their career choice and are pleased with the course of their career development. Consequently, devising ways to promote a more favorable view of the profession may be the most effective way to make a positive contribution to the lives and careers of symphony musicians.
References
Allmendinger, Jutta J., J. Richard Hackman, and Erin V. Lehman. 1994. Life and Work in Symphony Orchestras: An Interim Report of Research Findings. Report No. 7. Cross National Study of Symphony Orchestras. Cambridge: Harvard University.
Lambert, M.J., and G.M. Burlingame. 1996. Outcome Questionnaire (OQ-45.2). Stevenson, MD: American Professional Credentialing Services.
Lambert, M.J., N.B. Hansen, V. Umpress, K. Lunnen, J. Okiishi, G.M. Burlingame, J.C. Huefner, and C.W. Reisinger. 1996. Administration and Scoring Manual for the OQ-45.2. Stevenson, MD: American Professional Credentialing Services.


